Crude Oil Price Analysis
-------around 2010 with the onset of long-term shortage
by Carmen Wong (B.Fin HKU)
Introduction
Oil is one of the most important resources in our world. Crude oil price fluctuation could bring a lot of economic instability. In this report, the history of oil price and the data of rig count will be shown and discussed. With improving technology, how does it advance oil industry? Since there is resource constrain, can discovery really driven by higher oil price? What is the future of crude oil price?
Oil Price Outlook
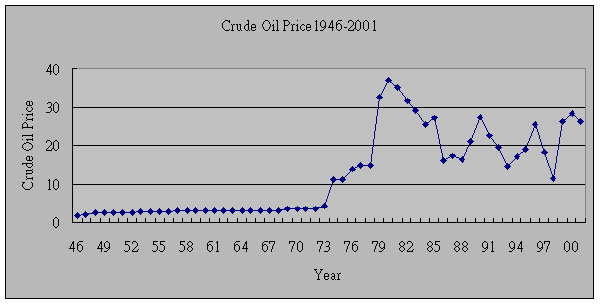
The oil price rose from $2.50 in 1948 to about $3.10 in 1957. However, this apparent price increases were just keeping up with inflation. From 1958 to 1970 prices were stable at about $3.00 per barrel, but when we consider with inflation, the real price of crude oil declined actually. The decline in the price of crude when adjusted for inflation was further exacerbated in 1971 and 1972 by the weakness of the US dollar.
In 1972 the price of crude oil was about $3.40 and by the end of 1974 the price of oil had climb up to $12.00. The Yom Kippur War started with an attack on Israel by Syria and Egypt on October 5, 1973. The United States and many countries in the western world showed strong support for Israel. As a result of this support, Arab exporting nations imposed an embargo on the nations supporting Israel. Arab nations curtailed production by 5 million barrels per day (MMBPD) about 1 MMBPD was made up by increased production on other countries. The net loss of 4 MMBPD extended through March of 1974 and represented 7 percent of the free-world production. The extreme sensitivity of prices to supply shortages became all too apparent. Prices increased 400 percent in six short months.
From 1974 to 1978 crude oil prices increased at a moderate pace from $12 per barrel to $14 per barrel. When adjusted for inflation the prices were constant over this period of time.
Events in Iran and Iraq led to another round of crude oil price increases in 1979 and 1980. The Iranian revolution resulted in the loss of 2 to 2.5 million barrels of oil per day between November of 1978 and June of 1979. In 1980 Iraq's crude oil production fell 2.7 MMBPD and Iran's production by 600,000 barrels per day during the Iran/Iraq War. The combination of these two events resulted in crude oil prices more than doubling from $14 in 1978 to $35 per barrel in 1981.
From 1982 to 1985 OPEC attempted to set production quotas low enough to stabilize prices. These attempts met with repeated failure as various members of OPEC would produce beyond their quotas. During most of this period Saudi Arabia acted as the swing producer cutting its production to stem the free falling prices. In August of 1985, the Saudis tired of this roll. They linked their oil prices to the spot market for crude and by early 1986 increased production from 2 MMBPD to 5 MMBPD. Crude oil prices plummeted below $10 per barrel by mid year.
A December 1986 OPEC price accord set to target $18 per barrel was already breaking down by January of 1987. Prices remained weak. The price of crude oil spiked in 1990 with the uncertainty associated Iraqi invasion of Kuwait and the ensuing Gulf War, but following the war crude oil prices entered a steady decline until 1994.
The price cycle then turned up. With a strong economy in the United States and a booming economy in Asia increased demand led a steady price recovery well into 1997. This came to a rapid end when OPEC underestimated the impact of the financial crisis in Asia. In December, OPEC increased its quotas 10 percent to 27.5 MMBPD but the rapid growth in Asian economies had come to a halt. Crude oil price dropped to about $11 in 1999. Then, with the recovery in Asia and the decreased in oil quotas by OPEC, price bounced to over $28per barrel. In July2001, the price was about $26.
Rig Count
Rotary rigs running
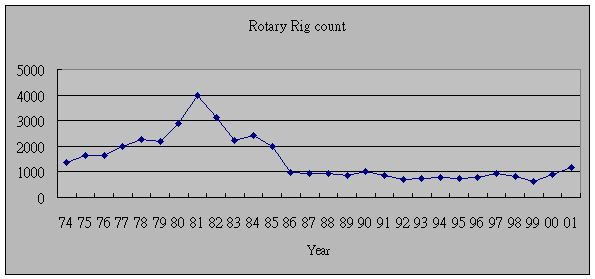
The Rotary Rig Count is the average number of drilling rigs actively exploring for oil and gas. It indicates the health of the oil industry. Since drilling an oil well is a capital investment in the expectation of returns from the crude oil production, it is also a measure of how much confidence the oil industry has in the future.
At the end of the Arab Oil Embargo in 1974 rig count was below 1500. It rose steadily with regulated crude oil prices to over 2000 in 1979. From 1978 to the beginning of 1981 domestic crude oil prices exploded from a combination of the rapid growth in world energy prices and deregulation of domestic prices. Forecasts of crude oil prices in excess of $100 per barrel fueled a drilling frenzy. By 1982 the number of rotary rigs running had more than doubled.
It is important to noted that there was one year time lag between crude prices and rig count of drilling but it is now reduces to a matter of months after the steep decline of crude prices in 1986. Like any other industry that goes through hard times, the oil business emerged smarter and learner. Companies long familiar with accessing geologic risk added price risk to their decision making.
Rig count is only a good measure of oil exploration activity, but not success. However, the percentage of wells completed as oil or gas wells (completion rate) is often used as a measure of success.
In 1948, immediately after World War II, 65 percent of the wells drilled were completed as oil or gas wells. This percentage declined to about 57 percent by the end of the 1960s. It rose steadily during the 1970s to reach 70 percent at the end of the decade. This was followed by a modest decline through most of the 1980s. Beginning in 1990 shortly after the harsh lessons of the price collapse completion rates increased dramatically to 77 percent.
The steady drop of the completion rates in the 50s and 60s and the increases of the 70s were more related to price. When a well is drilled, the fact that oil or gas is found does not mean that the well will be completed as a producing well. The determining factor is economics. If the well can produce enough oil or gas to cover the cost of completion and the ongoing production costs it will be put into production. Otherwise, it's a dry hole even if crude oil or natural gas is found. The conclusion is that if real prices are increasing we can expect a higher percentage of successful wells. Conversely if prices are declining the opposite is true.
The increases of the 1990s, however, cannot be explained by higher prices. These increases are clearly the result of improved technology. The increased use of and improvements to 3-D seismic data and analysis combined with horizontal and directional drilling. Most dramatic is the improvement in the percentage exploratory wells completed. In the 1990s completion rates have soared from 25 to 45 percent.
Workover Rigs
Workover rig count is a measure of the industry's investment in the maintenance of oil and gas wells. It is another measure of the health of the oil and gas industry. Most workovers are associated with oil wells. Workover rigs are used to pull tubing for repair or replacement of rods, pumps and tubular goods which are subject to wear and corrosion.
It is quite worrisome with a low level of workover activity because it indicates deferral of maintenance. When operators are in a weak cash position workovers are delayed as long as possible.
Technology and market force
The flat earth economists tell us that if we want more oil, all we have to do is drill more wells. They believe that improving technology and higher oil price can increase oil supply. This is only true to a certain extent. No one disputes the huge technological advances of the industry. But, what has been the impact? In Exploration, it shows better both where oil is - and where it is not- thus allowing better estimates of the potential to be made. In Production, it keeps production rate higher for longer, but has little impact on the reserves themselves. Note that much of the oil in a reservoir cannot be extracted because it is held there by capillary forces and natural constrictions. The percentage recovered can be improved in some cases, but by no means all cases. Most modern fields are produced to maximum efficiency from the outset. It is important to know the endowment in nature. Oil is natural resource that supply will come to the end one day. Now, we have produced almost half what is there, and we have found about 90 percent. We produce 22 Gb a year but find only 6 Gb. That is to say, we find one for every four we consume from our inheritance of past discovery. The current depletion rate is about 2 % a year.
Facing the future
The world now faces two-phased crisis. The first is a price shock from the ever-greater dependence on the Middle East. The second comes around 2010 with the onset of long-term shortage. In short-term, crude price may have some pressure according to world economic depression and falling demand on oil. Nevertheless, it will be rising in long-term. Now, OPEC targets the price at $25 per barrel. Now we find one for every four we consume from our inheritance of past discovery. With this high depletion rate, will oil price still be $25 per barrel when oil supply become lesser and lesser and dependence on the Middle East become greater and greater? The answer is NO. Oil price must be on a long-term rising trend.
Carmen Wong (B.Fin HKU)
2002-1-15